The mention of March Madness conjures up images of Grant Hill heaving the ball from the opposite inbound line to Christian Laettner for the buzzer beater as Duke edged Kentucky in OT, UCLA’s Tyus Edney running the length of the court for the buzzer beating layup against Missouri in ‘95, or even the iconic Magic vs. Bird, Michigan State vs. Indiana State classic way back in 1979. But timeless moments and incredible memories are only part of the whole show. There is a lot more going on behind the scenes.
In 2022 alone, it’s estimated that $3 billion was wagered on March Madness. While some of this is legal betting in sportsbooks, some of it betting online, and some of it not-so-legal, friendly office pools, it is typically a bigger betting handle than the Super Bowl, which is saying a lot. At the time of this publication, and according to the American Gambling Association, 31 states now have legalized sports gambling, so that $3 billion figure is bound to increase.
This doesn’t even take into account the regular season. There are more than 350 Division I men’s college basketball teams, with 32 conferences. When it’s all said and done, there are ~5,000 D1 men’s college basketball games from the beginning of the season through the National Championship.
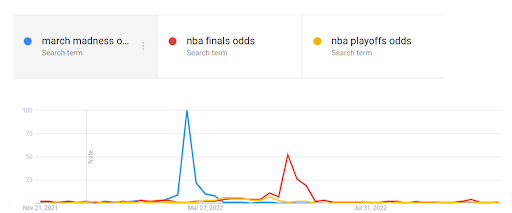
In addition to the $3 billion March Madness betting handle, TV ads also account for another billion dollars. Then there’s the online interest, which is massive. You can see that interest spikes during March and early April:

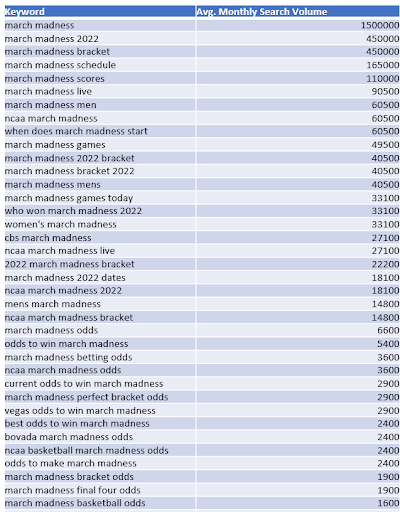
Source: Google TrendsThe image below is only accounting for a handful of search terms driving people to NCAA Tournament content. This is just the tip of the iceberg, but you can see that March Madness-related queries drive tens of millions of visitors. Keep in mind, the monthly search volume is averaged over 12 months, meaning that since most of that traffic comes in less than a one month period between March and April, you can multiply those totals by 12. It’s a lot of traffic in a short amount of time.

Why does this matter? Because whether it’s driving new traffic to a website, increasing fantasy pool signups, driving new first time depositors, or subscription trials, March Madness is big business and critical to any companies that cover sports on their website.
When the time comes to plan, editorial teams and online content marketers have to be asking themselves, “what am I doing to capitalize on this huge yearly event?”
With 68 teams, many more hopefuls, and additional smaller tournaments, there is generally some level of investment (financially or emotionally) in all corners of the country and beyond. What makes it even more unique is the universal level of interest in the entire tournament, not just local and hometown teams.
The problem is that there is so much to cover. With close to 5,000 regular season and conference tournament games, and another 67 March Madness games, there is an opportunity to cover fascinating feature stories, classic rivalries, heartwarming underdog stories, exciting Cinderella picks, game previews, game recaps, betting previews, and more. It’s a lot to take in, and it takes a lot of time and resources to cover even a good chunk of all the storylines. This is where Data Skrive can help.
We know how important it is to be ready for the next NCAA basketball season and March Madness. You don’t have to spend weeks outlining a content calendar. You don’t have to hire a team of writers to cover the basics. If you really want to scale up and cover every single game, we make it easy and cost effective. From game previews to betting previews and prop betting articles, futures to team capsules, Data Skrive can help you drive the college basketball traffic and revenue you know is out there waiting for you.
Data Skrive College Basketball Success Stories
Customer A
This website is relatively small, with less than 16,000 indexed pages, and an SEMrush Domain Authority score of 51. The site also had manually written content covering the tournament (targeting different audiences, keywords, etc.)
Between Selection Sunday (March 13, 2022) and the day after the tournament ended (April 5, 2022), Customer A’s manual articles drove ~7,000 organic clicks (according to Google Search Console), while Data Skrive-generated March Madness game preview articles drove ~14,000 organic clicks (according to Google Search Console), accounting for 10% of the total traffic to their site over that time.
Over the entire course of the 2021-22 college basketball season, Data Skrive-generated more than 315,000 clicks, accounting for 30% of the total organic traffic to the site from late October through mid-April. Notice the sheer volume of traffic the regular season game previews drove. The takeaway here is that while it’s important to cover March Madness, the competition for regular season games is much less. Everyone tends to cover the North Carolina vs. Duke championship game, but not everyone covers the Alcorn State vs. Belmont game. And while the search volume for the latter game is much less, the obtainable piece of search volume pie is much larger. Imagine driving qualified traffic for all 5,000 college basketball games over the course of a season.
Customer B
Customer B is a sub-domain of a major media publishing company. The sub-domain has ~38,000 pages indexed on Google, while the entire domain has more than 190 million. The Domain Authority is high, at 85.
Between Selection Sunday (March 13, 2022) and the day after the tournament ended (April 5, 2022), Data Skrive-generated March Madness game preview articles drove more than 93,000 organic clicks (according to Google Search Console), accounting for ~6% of the total traffic to their site over that time. Customer B also created manually written articles, which also drove a good deal of traffic, but required more resources to create.
In a nutshell, that is 93,000 organic clicks to the site from just 67 game articles. That is a whole lot of fan engagement in a short period of time.
What did you do to cover March Madness and get your piece of the pie? If you are interested in scaling up and increasing your share, we are here to help.


